
Dashboard redesign for New York City human resource users
A redesign of an HR dashboard for the NYC Administration for Children's Services (ACS).
Role
Lead designer
Team member:
-
Maima Syakhroza
Timeline
September- October 2025
(5 weeks)
Tools
Figma and Figjam
Project overview
Setting the stage
Company
New York City Administration for Children’s Services (ACS)
Client
Office of Human Resources (OHR)
My Role
As the lead designer in a team of two, I was responsible for redesigning dashboard interfaces to meet the needs of different HR user roles.
Overview
The Administration for Children’s Services (ACS) employs over 7,000 New Yorkers to promote the safety and well-being of the city's children, youth, and families. The Office of Human Resources (OHR) supports the management of the agency's employees through recruitment, hiring, payroll, workers’ compensation, and retention efforts.
The Office of Human Resources (OHR) has spent the last nine years developing a management system that would transition its internal processes from physical to fully digital. OHR partnered with a vendor to build the Human Resources Management System (HRMS), a five-module system.
The goal of this project was to understand the user needs of a newly created HR management system (HRMS) and design an internal-facing HR dashboard.
The problem and constraints
Onboarding the client
The dashboard proposed by the vendor for ACS did not provide the actionable insights required for the day-to-day operations of HR staff members. With eight different HR roles using this HR management system and a limitation in time, our main point of contact, the executive director, mandated that we only design the dashboard for the HR manager role, the main user of the system, and lean on her as both the subject matter expert and interviewee.
Constraints for this project included the contract period with the vendor as well as my part-time role, which afforded me only two days per week with the client. As such, five weeks were allotted to redesign the HR dashboard.

Proposed dashboard
Project Goals
Initial check-in
We began with the following design goals, as agreed upon with our client:
Goal 1: Streamline ACS's HR process for tracking and completing PAR request statuses. The dashboard should track the number of each personal action request (PAR request) type in each HR employee role's queue for each stage over time.
Goal 2: Measure how long PAR requests take to be brought to a closed or completed status.
Goal 3: Align redesign with dashboard requirements as pre-established with the vendor.
Our process
Discover, ideate, materialize

Discover
The background check
To fully understand the needs of an HR dashboard, we conducted the following:
Interviews
To best understand the needs of my client, interviews with our key stakeholders were conducted.
Interviews began with the project lead, the Executive Director of the Staffing Management Unit (SMU). Additional interviews were conducted with three additional HR staff members who would ultimately need to use this dashboard as well, for a total of four interviews for the HR dashboard.
Goals
-
Understand the needs and pain points of the suggested dashboard
-
Understand the roles and goals of the recruitment team using this HRMS dashboard
Insights
These interviews highlighted the need to highlight actionable items as well as HR processing trends:
-
Need to see where employee PAR requests are getting stuck
-
Average processing time
-
High-level summary of active vs completed employee PAR requests
Comparative analysis
We evaluated seven other dashboards for best practices in data representation and webpage layouts.
Our findings indicated that dashboards highly rely on widgets and data visualization to tell complex stories. It's also common to utilize a left navigation bar to navigate to different pages. The trend for offering filters and allowing users to create new entries from the dashboard seems to vary, however, given that the users of this dashboard work with a large number of employees and requests, offering both of these functionalities is essential.

Explore
Finding the perfect candidate
Wireframes
Based on business needs, we researched dashboard design trends in competitors and ideated upon potential widget designs. We looked for designs that were simple, clear, and relevant to the data we needed to showcase, leveraging data visualization to tell the more complex stories.
These findings led us to sketch three different dashboard concepts:
First wireframe concept
The first leveraged data visualization through tables and line charts to communicate the needs identified from our interviews.
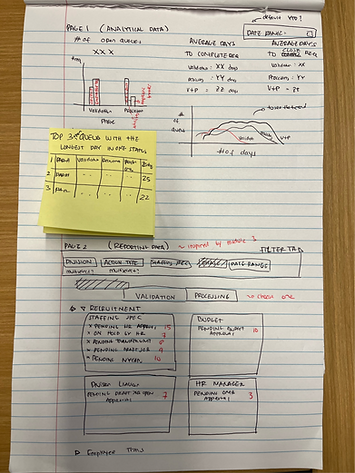
Second wireframe concept
The second option offered widgets of number counts only

Third wireframe concept
The third combined the prior two and combined line charts, bar graphs, pie charts, and number count widgets to convey information.


We shared the three wireframes with our clients, who then selected the third wireframe to move forward with. With their acceptance, we moved on to mid-fis to better share what the dashboard would look like and shared these as well with the leadership team.
A meeting with the HR Deputy Commissioner and multiple Assistant Deputy Commissioners was called to provide additional feedback and a broader perspective on what was necessary from the dashboards. These insights informed additional iterations of our designs.
Insight 1:
Users mostly want to know if the Office of Budget is holding up their process
Insight 2:
Highlight PAR requests that have had no action taken
Insight 3:
Need a quick story or summary of what’s happening in HRMS
Overall Takeaway:
Need to know where there are issues and challenges in HRMS
The final offer: dashboard redesigns
Our final dashboard design encompassed multiple rounds of research, client feedback, iteration, and ultimately, client approval.
Solution 1: an emphasis on request types
Four of our ten widgets solely show numbers, broken down by request types and the stage they were in. As requested by the client, this method provides a high-level overview of the total pending requests, broken down by each stage.

Solution 2: data visualization widgets
These formats convey a high-level visual, relational representation of HRMS recruitment data. Through pie charts, line graphs, and clustered bar charts, users can compare multiple factors impacting recruitment processing over time, an insight that proves to be particularly useful for reports.

Solution 3: time sensitivity
Our widgets employ icons, colored blocks, and comparative progress bars to inform users of what actions need to be taken. For HR staff, action may be in the form of pushing PAR requests forward or identifying where requests are getting stuck for too long.

Materialize and next steps
Results
Client Feedback
It was greatly rewarding to collaborate with an amazing team of HR professionals. With little to no prior HR background, they were so essential to ensure the creation of a design that met their needs. I wanted to ensure that I led this design with empathy and could push forward their needs, and as a result, they emphasized many times their appreciation for being a part of the design process. As much as possible, moving forward, I plan to continue to create space for the voices and needs of the users of digital spaces that I design, so that they are created both for them and alongside them.
The vendor shared no concerns associated with building the dashboard as designed, nor misalignment with the predefined business requirements. The HR system is expected to go live in spring 2026.
User Testing
Given our time constraints, user testing was not conducted prior to the handoff to development. As such, usability testing with HR staff during UAT is essential for offering any redesign adjustments as needed.